Year in review: A look back at what shook Melbourne’s real estate industry in 2017
By all major accounts, 2017 has been another bumper year for Melbourne property. In the past 12 months, the city has achieved a new house price record (a Toorak property in the vicinity of $40 million), double-digit price growth (up 14 per cent, according to the Real Estate Institute of Victoria) and a record number of auctions almost every month.
Factors underpinning this exceptional growth have been the rising population, lack of housing supply, the introduction of new first-home buyers’ initiatives and interest from foreign buyers.
“Multiple auction records were broken this year, with 2017 challenging 2015 as the strongest property market on record,” says REIV president Richard Simpson.
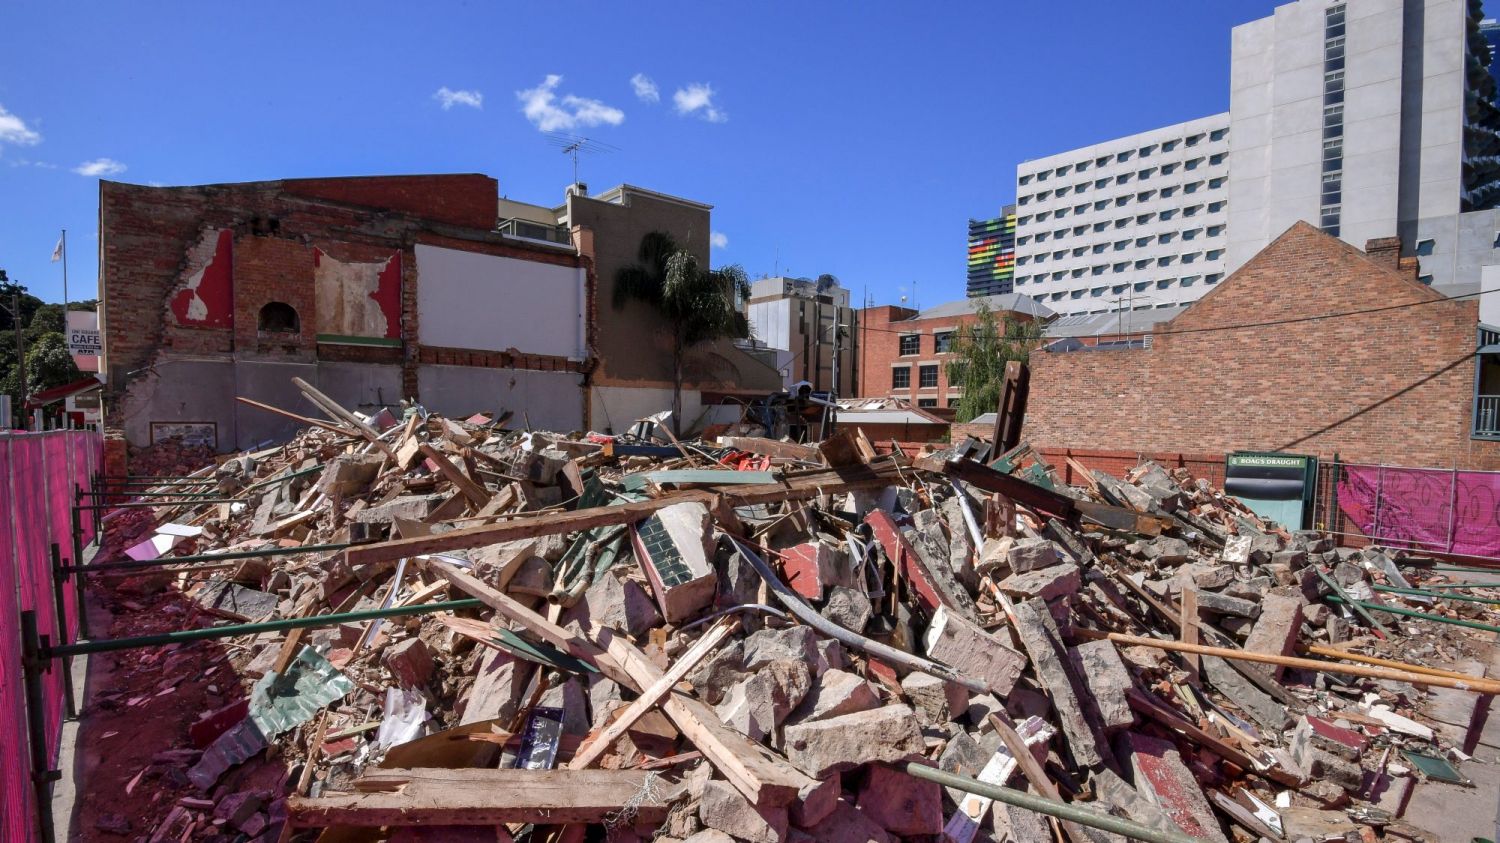
All that was left of Carlton’s Corkman Irish Pub immediately after its illegal demolition. Photo: Eddie Jim
The booming market has also spawned several water-cooler conversation topics over the year, such as the efficacy of heritage protection laws after the unauthorised demolition of Carlton’s Corkman Irish Pub built in 1857.
“The unlawful demolition of the Corkman Irish Pub at the end of 2016 was a watershed moment for heritage in Victoria. It caused many people to reflect on the value of heritage, and also the intensity of development pressures that are placing it under threat,” says Simon Ambrose, chief executive of the National Trust of Australia (Victoria). Ambrose believes this event inspired increased advocacy in 2017 for stricter protection over significant properties.
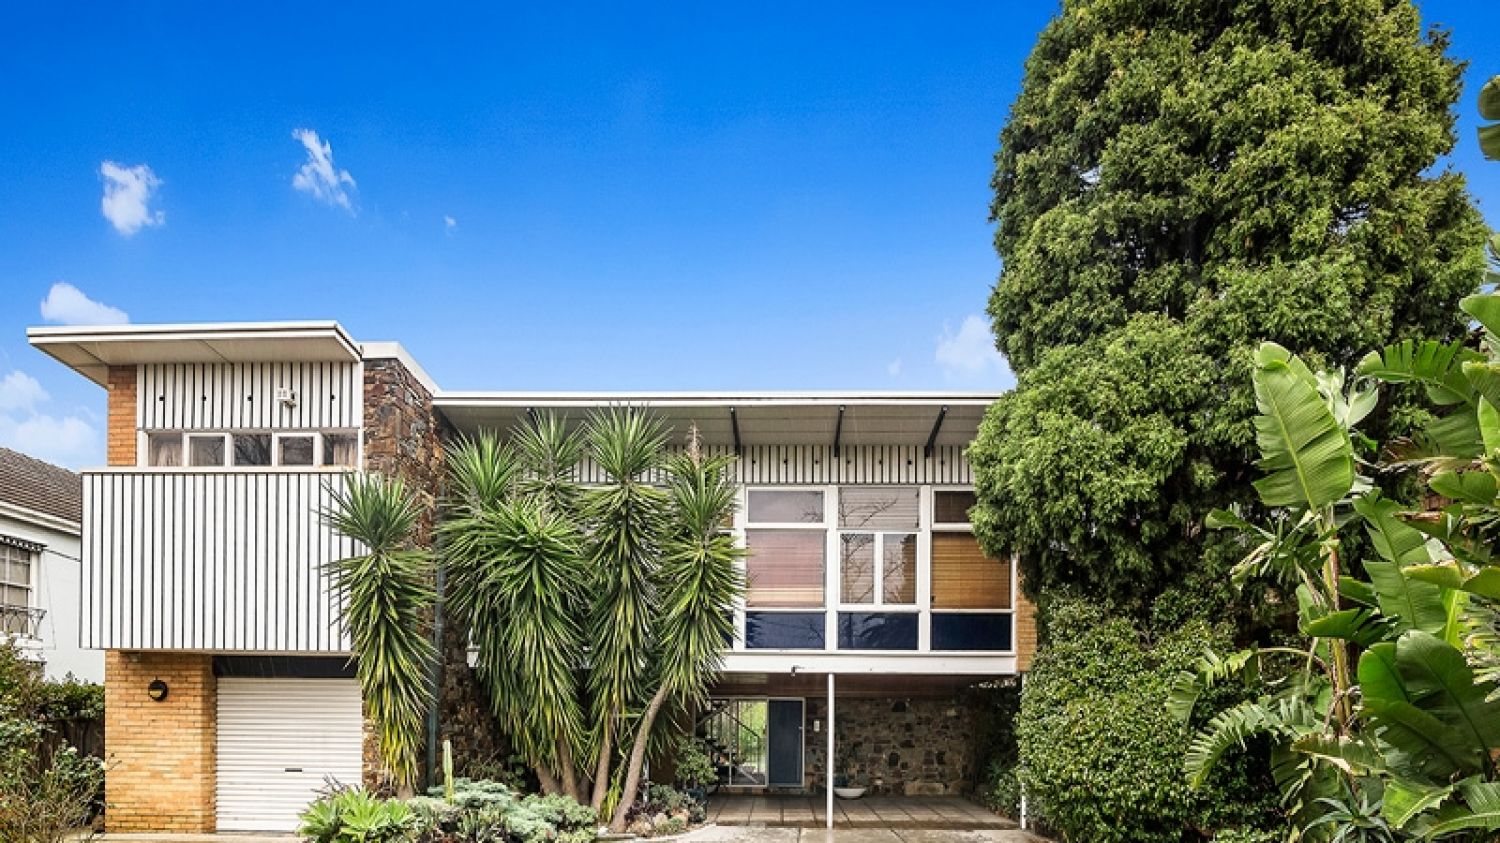
“Architect Anatol Kagan’s Lind House at 450 Dandenong Road in Caulfield North is a great example of this, with Glen Eira responding to community concerns about the proposed demolition of the house by seeking interim heritage protection, and committing to a more comprehensive postwar heritage study across the municipality,” Ambrose says.
Architect Anatol Kagan’s Lind House at 450 Dandenong Road in Caulfield North. Photo: supplied
Another much-discussed topic was the May 1 introduction of new underquoting legislation designed to curb misleading price guides on properties. The effectiveness of these laws has been debated, but overall experts say they have been successful in reducing the margin between estimated and actual property prices.
“The REIV supports the new legislation and has promoted improved practices to all agents,” Simpson says.
“There have been a number of unintended consequences arising from the new legislation, which hopefully will be addressed in the near future. Furthermore, its applicability in regional Victoria is questionable – due to the limited number of comparable sales available in the country regions.”
Be prepared to negotiate to ensure you end up with the keys. Photo: Peter Braig
Jellis Craig managing director Andrew McCann says any early hiccups in the implementation of these laws will likely be overcome with further education of consumers and agents.
“Change of practice in any industry is challenging,” McCann says.
“I think that Consumer Affairs have some responsibility to work harder around educating the marketplace on both sides. A lot of buyers still don’t understand what the legislation is and what it means.”
Citywide price growth is expected to moderate in 2018, however, areas that continue to offer affordability are well placed to experience significant capital gains Photo: Nelson Alexander
In 2018, industry experts predict the median house price (currently $880,902) will continue to rise, but at a slower rate than previous years.
“We expect citywide price growth to moderate in 2018, however, areas that continue to offer affordability are well placed to experience significant capital gains,” Simpson says.
RT Edgar director Oliver Booth says, in his opinion, prices will remain strong. “However, I don’t think we will see the same level of growth as what we have seen previously,” he says.
Fletchers director Tim Heavyside envisages “a gradual rise in the market somewhere between 5 to 8 per cent.”
Also set to shake up the industry in 2018 is the introduction of new tenancy reforms aimed at providing renters with more rights.
The new rules include the abolition of rental bidding practices, the creation of a landlord “blacklist”, the banning of “no pets” clauses in tenancy agreements and faster rental bond repayments.
If you are looking for an affordable home in your preferred suburb, it may pay to find the street with the silliest name.
House prices on streets with silly names are significantly lower than houses on nearby streets, a study by Victorian school students has found.
High school girls at Sacred Heart College (SHC) in Geelong conducted the research with guidance from the school's head of science, Adam Cole.
The students identified 27 streets in Victoria with silly names, including Butt Street, Wanke Road and Fanny Street.
"We looked at them on Google Maps and found two adjacent streets with relatively normal names," Dr Cole told ABC Radio Melbourne's Jon Faine.
Working with staff from the Australian Bureau of Statistics, the University of Sydney and a Melbourne real estate agent, the girls analysed house sales on the streets over the past 47 years.
They found that property prices in streets with silly names were about 20 per cent lower than properties in the normally-named roads.
As the report notes, that amounts to a $140,000 saving on a median-priced Melbourne house.
Embarrassment drives down prices
To explore the reasons behind their findings, the girls surveyed 323 adults about their attitudes towards silly street names.
One third of those surveyed said they would not be happy living in a street with a name like Beaver Street, Willys Avenue or Grogan Court.
Dr Cole said it was likely this affected the supply-and-demand equation for properties on those streets.
"We think that there is a proportion of people that would not be comfortable living in those streets, so they don't compete for those properties and that would drive prices down," he said.
"We think it's probably got to do with a proportion of people being embarrassed by the address when they have to give it out."
The silly name effect was more prevalent in the capital city suburbs than in regional areas, Dr Cole said, which was "probably because there's more supply, there's more choice in Melbourne".
The price discrepancy was also greater in lower-priced properties than more expensive ones.
Research a long-term project
The team behind the study analysed more than 4,500 property sales totalling nearly $1.5 billion to reach their findings.
The research was conducted by members of SHC's Bradbury Club, which students can elect to join to pursue long-term science, technology, engineering and mathematics (STEM) projects.
"We don't talk about science, we don't talk about coding or geography or anything like that," Dr Cole said.
"We just have a project to do, and we get it done, but along the way the girls will be learning."
This article was originally published by Ming Haw Lim on 23 Nov, 2017 via news.com.au
WITH house prices surging by as much as $100,000 over 12 months, Frankston North is among Melbourne’s top-performing suburbs, latest data reveal.
The small battler suburb sits in third spot with 38 per cent annual growth in median house value to $434,183, according to CoreLogic figures in the 12 months to July.
The more affluent areas of Middle Park and St Kilda are the top two performing suburbs.
Frankston North was not the only suburb in the Frankston region that experienced huge price growth after attracting the interest of family buyers and investors.
Seaford recorded a 26.6 per cent annual growth to $664,897 to sit on 13th spot, while Carrum Downs had 24.5 per cent growth to $480,636 on no. 20.
Frankston North houses also breached the $600,000 price benchmark this year and agents said many houses had seen price growth of more than $100,000 over a year.
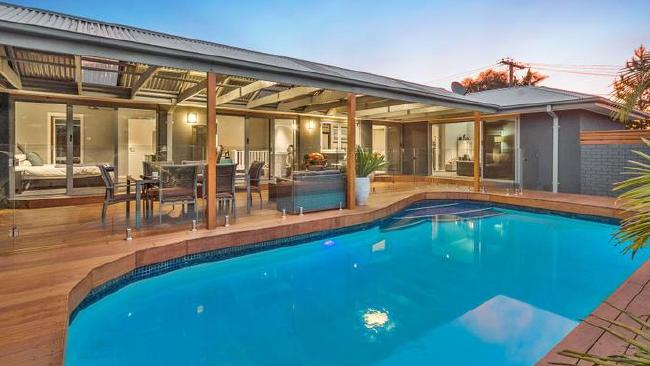
The eye-catching entertainment area at 1 Elisdon Drive, Seaford.Source:Supplied
“Frankston North house prices took a long time to grow but are now catching up with surrounding areas,” Ray White Frankston agent Brooke Wegener said.
“The suburb represents good value for money and has attracted plenty of first-home buyers and investors.”
While there are few units and townhouses in the suburb, this is expected to change as developers have bought larger blocks to build such homes, Ms Wegener said.
She expected prices to grow at a slightly slower but steady pace in future with strong demand and limited supply pf properties in the suburb.
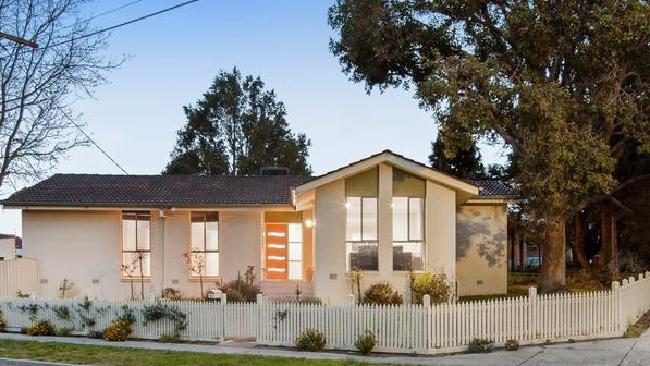
2 Golden Court Frankston North recently sold for $542,000. Source: Supplied
2 Golden Court has a modern-style renovated kitchen. Source: Supplied
The agency recently sold 2 Golden Court, Frankston North, for $542,000. The house price had risen $221,000 from its previous sale in 2014.
In Seaford, house price growth in recent years has been driven mainly by young families moving in, Eview Discover agent Daniel McGlashan said.
“We have seen many buyers coming from inner bayside suburbs because of the affordable homes in Seaford,” he said.
“Prices have grown by more than $100,000 a year but this has not put off buyers because they are attracted to the access to the beaches and freeway.”
Mr McGlashan noted several million-dollar house sales in the suburb this year had lifted the profile of the suburb,
A three-bedroom house at 1 Elisdon Drive, Seaford, attracted 10 offers to sell recently for $780,000. It more than doubled its 2008 selling price of $318,000.
MELBOURNE’S traditional battler suburbs have blossomed into our property stars.
Frankston North came in third for median house value growth in the most recent 12 month period captured by CoreLogic — rising 38 per cent to $434,183.
Ardeer and Sunshine also featured in the state’s top 10, surging about 30 per cent each to median house values of $537,933 and $744,144 respectively.
And Broadmeadows, Deer Park, South Morang, Seaford and Carrum Downs all featured in Victoria’s top 20 for annual growth performance to July.
The data takes into account all properties in a suburb and is considered a more accurate indicator of the market than median sale prices, which only take into account sales within a certain period.
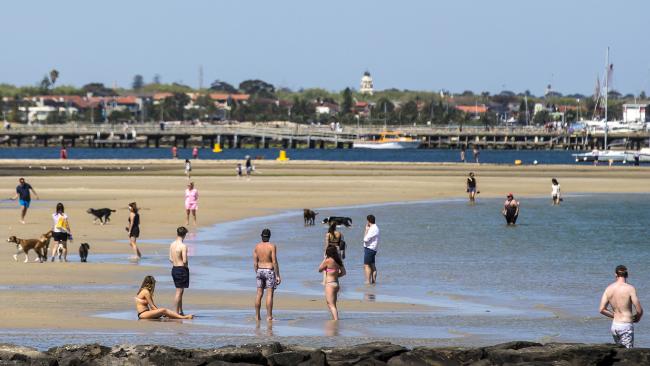
Frankston beach is a drawcard for buyers in Frankston North. Picture: Jake Nowakowski Source:News Corp Australia
CoreLogic state director for Victoria Geoff White said investors and homebuyers were looking to more affordable suburbs to get a leg up in the property market.
“They’re looking for properties that are affordable and manageable in terms of repayments and borrowing, the general amenities of the area and in some cases proximity to the city,” he said.
“Between all those reasons that’s why they’re starting to feature.”
Mr White said most of those suburbs were well under the Melbourne median price and buyers were seeking places where they saw potential for future growth.
“You’re seeing little pockets of Melbourne that perhaps have not seen the growth (of other strong performers) over time and what would have been locations less desirable to live in are now becoming very desirable areas,” he said.
“The amenities, the demographics are sometimes changing in these areas, so buyers or potential buyers are seeing that as an opportunity to get in. Sunshine and those sorts of locations are not far from the centre of Melbourne, so that’s a major consideration, too.”
Middle Park had the strongest median house value growth over the 12 month period. Picture: Sarah Matray Source:News Corp Australia
Hocking Stuart, Frankston, director Aaron Froling said the Frankston North market had “levelled out” after its hectic boom.
“The popularity of Frankston North was just overwhelming how it shot up this year,” he said.
“It’s always been a bit of an unwanted area, and we had clientele paying whatever to get in there ... we are now experiencing a normal, balanced and healthy market.”
Mr Froling said affordability and proximity to the beach were the main drawcards of the suburb.
Blue-chip Melbourne postcodes continued to perform strongly, too, with Middle Park and St Kilda top of the list with growth of 48.3 per cent and 38.6 per cent respectively.
Realestate.com.au chief executive Nerida Conisbee said there was always going to be strong demand for these types of suburbs.
“Although we talk about housing affordability, there’s still a lot of people with a lot of money and that strong price growth in those areas certainly reflects that,” she said.
VICTORIA’S TOP PERFORMING SUBURBS FOR MEDIAN HOUSE VALUE GROWTH
Suburb, annual percentage growth to median house value, median house value
1. Middle Park, 48.3%, $2,585,585
2. St Kilda, 38.6%, $1,299,331
3. Frankston North, 38%, $434,183
4. Highett, 35.3%, $1,326,542
5. Elwood, 32.3%, $1,807,168
6. Malvern, 31.6%, $2,782,191
7. Ardeer, 30.6%, $537,933
8. Sunshine, 30.2%, $744,144
9. Hawthorn, 28.1%, $2,461,493
10. Kew East, 27.9%, $2,221,519
11. Balnarring, 27.8%, $749,766
12. Seaford, 26.6%, $664,897
13. Broadmeadows, 25.9%, $484,779
14. Deer Park, 25.7%, $503,372
15. South Morang, 25.7%, $607,368
16. Williamstown, 25.4%, $1,471,082
17. McCrae, 25.1%, $776,289
18. Healesville, 24.9%, $525,667
19. Nunawading, 24.5%, $651,833
20. Carrum Downs, 24.5%, $480,636
Source: CoreLogic, 12 months to July
This article was originally published by Nick Lenaghan on Nov 19, 2017 via afr.com
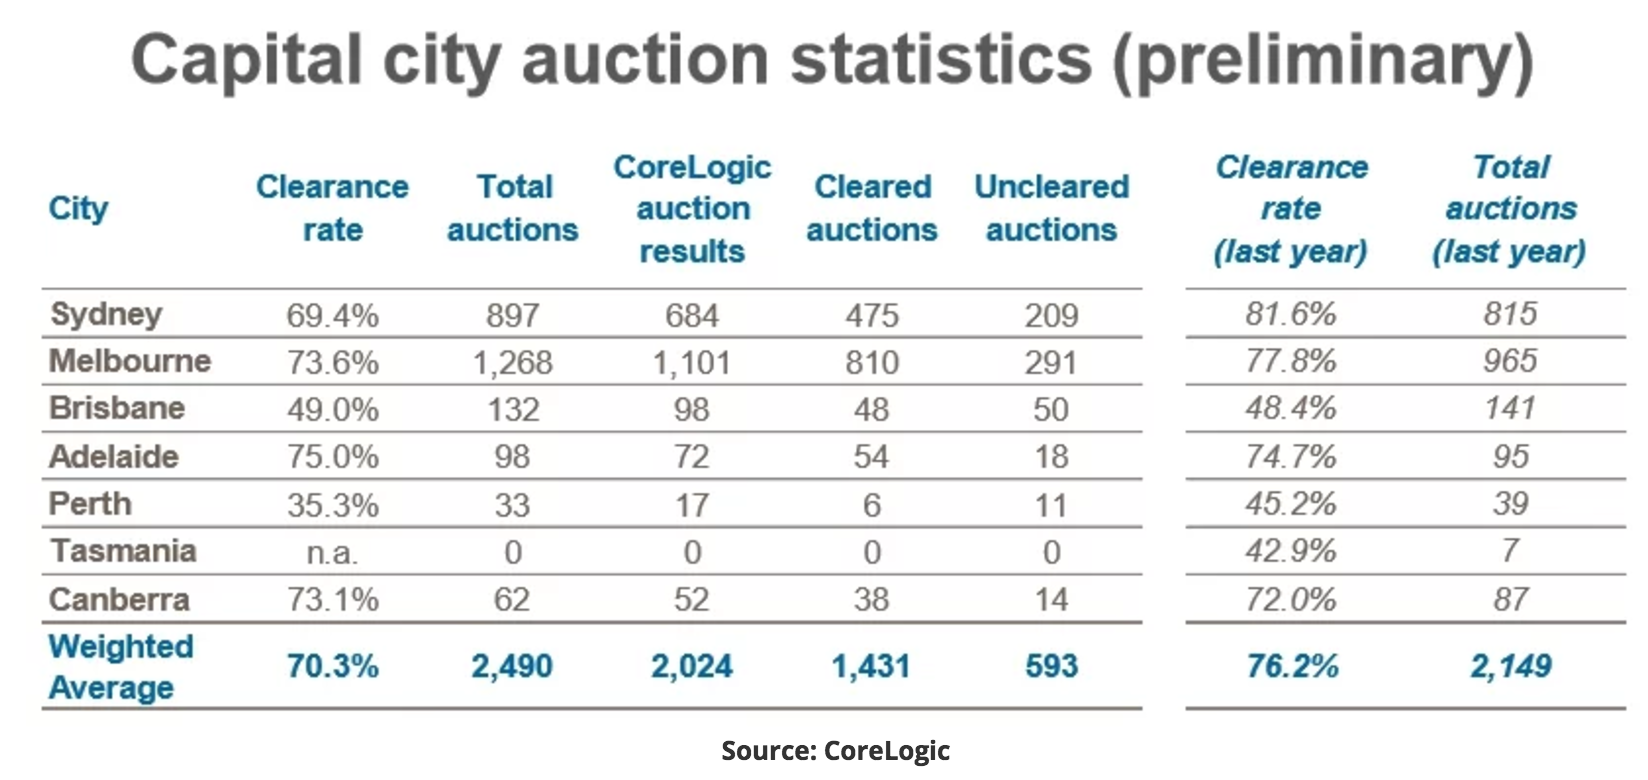
Auction clearance rates have eased back as investors pull out of the market, creating a build-up of stock especially in Sydney.
The preliminary auction clearance rate was 65.4 per cent this week across 3335 auctions nationally, making it the third busiest week for auctions so far this year, on CoreLogic figures.
That figure was up on the 62.8 per cent across 2907 auctions last week.
The shift toward a lower clearance rate has become more evident, with final clearance rates falling below 65 per cent for the past four weeks.
By contrast, at this time last year the 2987 homes taken to auction nationally achieved a clearance rate of 74.4 per cent.
Sydney has a softening market. It has recorded a preliminary clearance rate of 61.5 per cent so far, with 1035 properties taken to auction across the city.
Final clearance rates have been below 60 per cent since the last week of October in Sydney.
Melbourne booked a healthier rate of 69.6 per cent over 1717 auctions.
Despite the Sydney slowdown, a six-bedroom Paddington property on two titles sold for $5.16 million, comfortably above expectations.
The parkside property on the double block at 59 Harris Street and 14 Sutherland Avenue was put to the market for the first time in 60 years.
On a 412 square metre block, it included a freestanding double-fronted main residence and a self-contained cottage with separate entry.
With six registered buyers, bidding began at $4 million and the property was on the market at $5 million.
"We're still seeing good numbers in Paddington. There is a significant lack of good property in the suburb," said Sam Towndrow, of Ballard Property, who handled the Paddington property with colleague Sam Cooke.
Even so, he noted that the buyers are becoming "a bit more particular".
"If it's not 100 per cent at this time of year, then they will wait. If property is still priced well then buyers will attend to it."
Investor borrowing has fallen at its fastest pace in two years, official figures this month showed, with housing finance dipping 3.6 per cent overall. Sydney house prices dropped for the second month in a row in October, led by declines in prices of houses rather than apartments.
The cooling market adds weight to the Reserve Bank of Australia's point earlier this month that tighter lending standards and macroprudential controls are taking effect.
CoreLogic's Kevin Brogan expects clearance results could fall lower when they are finalised later this week .
"The trend in Sydney in particular recently is that it's been much more difficult for agents to complete the deal. That's exerted downward pressure on the final clearance rate."
The amount of stock on the market in Sydney is up by 20 per cent compared to the comparable period last year, as investors are side-lined by the clampdown in lending to their sector.
"From a buyer's point of view there is more choice. That increase in supply is a significant factor," Mr Brogan said.
Melbourne has not experienced a similar build-up in stock, with levels on par with where they were at in the comparable period last year, Mr Brogan said.
"That's where you're seeing a gap opening up between Melbourne and Sydney."
In Melbourne, the most expensive home sold at auction over the weekend was the five-bedroom home at 23 Maling Road in Canterbury, which changed hands for $4.125 million.
Meanwhile, the Canberra market performed strongly, with a 67.6 per cent clearance rate from 130 homes taken to auction. Adelaide booked a solid 66.3 per cent from 146 auctions.
In Brisbane, where voters are preparing for a November 25 state election, the clearance rate rose to 49.6 per cent across 213 auctions this week.
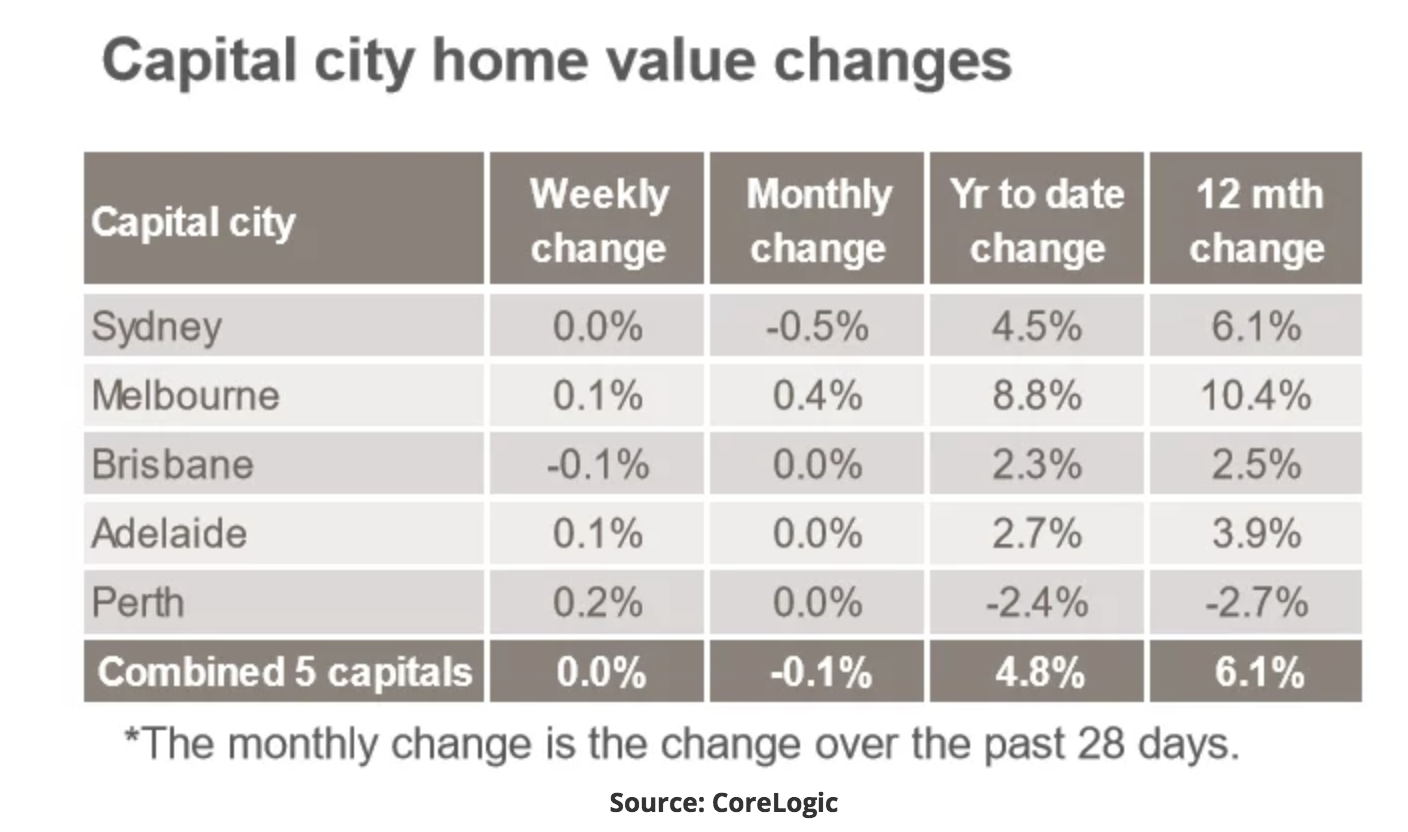
Sydney property prices are down 0.5% over the past month, leading a continued cooling in Australian housing market.
Data from CoreLogic showed price growth in Sydney was flat last week, which extended to markets nationally as average weekly growth across Australia’s five capital cities was unchanged.
Melbourne property prices edged higher after falling flat in the week prior, while gains in Adelaide and Perth markets offset the previous week’s falls of 0.1% and 0.2% respectively.
On a monthly basis, last week’s price moves returned the markets in Brisbane, Adelaide and Perth to flat growth while the Sydney market continues to drag average prices lower for the month of November.
That leaves the national average for annual price growth at 6.1%, down from 6.4% in the previous week and 9.7% in the 12 months to the end of June.
The price action comes amid a noticeable downturn in auction clearance rates in the larger Sydney and Melbourne markets.
The weekend data showed a preliminary clearance rate of 61.5% in Sydney, which may fall closer to 55% when final figures are released on Thursday.
Melbourne’s preliminary clearance rates slipped to 69.6% — down from 71.4% in the week prior — as 1,717 homes hit the market, up from 1,303 auctions at the same time last year.
Nationally, it was busy weekend of auction activity as clearance rates continue to track lower from levels above 70% back in June.
“The combined capital cities returned a preliminary auction clearance rate of 65.4 per cent this week across 3,335 auctions making it the third busiest week for auctions so far this year,” CoreLogic said.
“The final clearance rate has remained below 65 per cent for the last 4 weeks and it’s likely that this will be the case again on Thursday when the final results are released.”
The total number of properties listed for sale across Australia rose to 116,197 last week, up from 115,487 in the previous week.
Those gains continue to be led by the Sydney market, as the number of listed properties remains more than 20% higher than the same time last year.
Properties in Hobart — which currently has the fastest rate of house price growth among all Australian capital cities — continue to be more tightly held, with the number of listed properties down 35.1% from 12 months ago.
The following article was originally published by TIM McINTYRE on the 17 Nov 2017 via news.com.au
THERE are a number of reasons that the Australian real estate market will not crash, one industry insider says.
THERE has been much talk of property bubbles and huge price corrections for Australian real estate of late, but a recent survey showed most of us are not convinced.
The latest Mortgage Choice data revealed 64.3 per cent of Australians believe the housing market will continue to perform the same as it has in recent years, if not better.
Mortgage Choice CEO John Flavell puts the bright outlook down to the Australian love affair with home ownership.
“This data makes it obvious that the majority of Australians remain upbeat about investing in property and will continue to buy and sell dwellings,” Mr Flavell said.
Recent CoreLogic data has indicated price growth has stagnated over the last few months, with values showing an upside of just 0.4 per cent across the capital cities during the quarter to November.
Mr Flavell said this has caused panic among some industry figures.
“Many market commentators are suggesting that this is the beginning of the end,” he said. “Some have even gone so far as to suggest we could soon see a property price crash across some of the bigger markets, notably Sydney and Melbourne.
“The reality is property prices are merely stabilising after a few years of runaway growth. This is something we have long expected.”
A plateau in price growth is a long way off a market crash, Mr Flavell pointed out.
“For a crash to occur there would need to be a number of economic factors at play,” he said. “Firstly, supply would need to be high enough that it exceeded demand. Secondly, the cost of borrowing money would need to rise rapidly, and unemployment would also need to reach dramatically high levels.
“Moreover, there would need to be a large number of people looking to liquidate their properties at the same time.
“If all those factors were to occur, a crash could be a possibility, but based on how our economy is travelling at the moment, it is fair to say that we are not in for a crash.”
ABS statistics show the Australian population continues to grow steadily; by 389,100 over the last year alone.
“All of those people need somewhere to live,” Mr Flavell said. “At the same time, interest rates are low and we expect them to stay lower for longer.”
This article was originally published by business reporter Stephen Letts on Nov 9th 2017 via abc.net.au
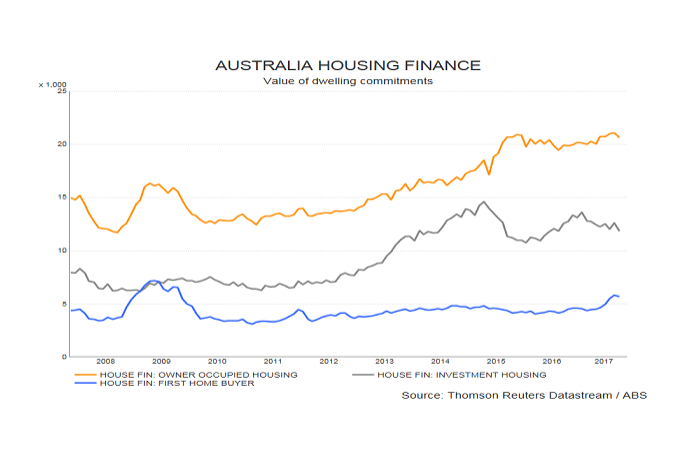
Property investors appear to be feeling the pinch from tougher lending rules and higher interest rates with a surprise slump in loans in September.
Seasonally adjusted housing lending figures released by the Australian Bureau of Statistics show investor loans tumbled 6.2 per cent over the month.
The fall follows a tightening of regulatory screws earlier in the year limiting the banks ability to lend to investors and driving up the cost of new interest-only loans.
Owner-occupier loans also declined (2.1 per cent), while the overall value of mortgages was down 3.6 per cent to $35.5 billion.
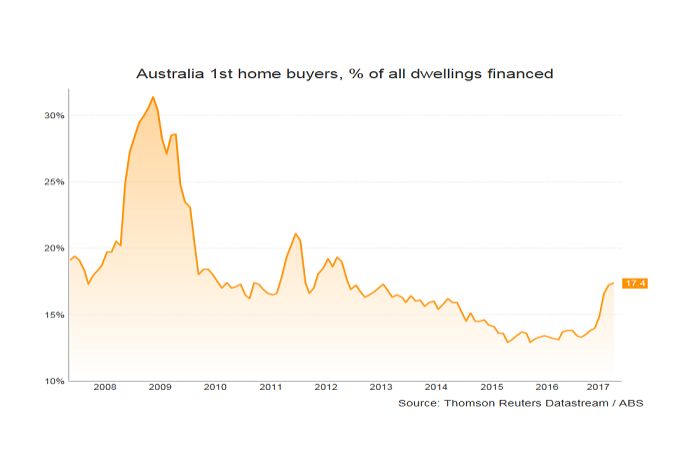
The retreat of investors has made life easy for first home buyers who have been taking a larger — albeit still small — slice of mortgage market in recent months.
First home buyers now account for 17.4 per cent of all new home loans, the highest level in four years.
They have also benefited from generous stamp duty discounts in New South Wales and Victoria.
The average size of first home buyer loans fell by $6,200 to $315,000, while across the entire market the average mortgage rose $2,100 to $371,000.
Gloomy with some positives
J.P. Morgan economist Henry St John said the figures showed mortgage lending was gloomy in September.
"Investor lending was unambiguously weak in September, and provides further evidence that August's modest uptick against the trend was more noise than anything else," Mr St John said.
The fall in investor lending was the sharpest in two years, taking the annual growth in the sector to 6 per cent, having grown closer to 30 per cent at the start of the year.
"The bearish trend in investor lending since April is well-established now," Mr St John said.
ANZ's Daniel Gradwell said within the negative headline number there were a few encouraging results on the policy front.
"APRA's macroprudential policy, aimed at investors and interest-only loans in particular, appears to be having the desired effect of taking some investor demand out of the market," Mr Gradwell said.
"While household debt is still growing faster than income, developments such as this allow the regulator and RBA to be patient."
The other positive trend is the figures is finance for the construction and purchase of new housing is still trending higher, especially in New South Wales and Victoria.
"This continues to imply that the current pickup in building approvals has further to run over coming months," Mr Gradwell noted.
Don’t miss out, CLICK HERE to get up to date video education from Konrad Bobilak.
Here is what you will learn by watching this video:
Whenever investors borrow above 80% LVR in order to buy an investment property, investors will have to pay Lenders Mortgage Insurance (LMI) for the privilege of doing so. At the time of writing this, the highest LVR offered in Australia via standard main stream lenders was 95% LVR plus LMI capitalised, equating to 97% LVR which includes the LMI premium.
Essentially, LMI simply refers to an insurance premium that is payable by the borrower, on behalf of the mortgagee, protecting the mortgagee against an event whereby the borrower defaults on their mortgage, dies during the mortgage or becomes unable to make repayments on the mortgage.
In Australia, there are two main LMI insurers used by most of the financial institutions and banks, namely, Genworth Financial and QBE. LMI is generally applicable on any loans over 80% LVR and 60% LVR for Low Doc loans. Having said that, some non-bank lenders, especially those offering non-conforming loans to the credit impaired sector, obtain LMI for every loan, irrespective of the LVR. In the event that a default occurs and the mortgagee (bank or lending institution) has to sell the property, any shortfall, less expenses, is insured by LMI.
LMI premiums vary depending on the loan amount; the higher the LVR the higher the premium charged. In the case of borrowing 81% LVR on a property purchased the LMI premium might be 0.3% of the total loan amount, compared to 95% LVR where the LMI premium may be as high as 3.5% of the total loan amount. So, to put that into perspective, on a $600,000 purchase, at 81% LVR the premium would be $1,458 ($600,000 @ 81% LVR = $486,000 x 0.3% = $1,458), on a 95% LVR the premium could be as hight as $19,950 ($600,000 @ 95% LVR = $570,000 x 3.5% = $19,950).
The question often arises, is it worth paying Lenders Mortgage Insurance premiums and borrowing above 80% LVR or is it better to structure a purchase with a 20% deposit and avoidLMI?
Well, it depends on your overall investment strategy, chosen time horizon for investing, available resources and equity or cash savings at hand when making this decision.
Don’t miss out, CLICK HERE to get up to date video education from Konrad Bobilak.
Don’t miss out, CLICK HERE to get up to date video education from Konrad Bobilak.
Here is what you will learn by watching this video:
One of the most fundamental principles of investing in property in Australia is to appreciate that the market moves in distinct cycles which are characterised by periods of strong capital growth and demand for properties, through to periods of a flat-lining market, following periods of distinctive falling median prices, lower demand for properties, and a decline in property prices.
The general rule of thumb is that these property cycles last 7 to 10 years, and can be segmented into 4 main parts, the 'Peak of the Market' being the shortest of the four;
Peak of the Property Market - High capital growth, auction clearance rates of 85 per cent plus.
Decline of the Property Market - Declining capital growth, auction clearance rates dropping from 80 per cent to 60 to 50 per cent.
Bottom of the Property Market - Extended periods of low capital growth, auction clearance rates of 45 per cent to 50 per cent.
Growth of the Property Market - Increasing capital growth, increase demand for property, increasing auction clearance rates, 55 per cent to eventually 75 per cent.
Would you like to know exactly where Melbourne of Sydney is located right now on the property clock?
If you gain just this one insight onto the world of property investing you will gain an unfair advantage over the rest of the property investors out there...
You see, money is made by both the timing of the market, and of time in the market.
Interested in learning more about property investing in Australia? Please visit our main website InvestorsPrime.com.au for loads of free resources, articles, videos and more to help you on your investing journey.