[NEW VIDEO]: Melbourne's Top 10 Best Cheapie Suburbs With High Capital Growth Potential In 2024
Don’t miss out, CLICK HERE to get up to date video education from Konrad Bobilak.
Dear Fellow Property Investor,
The Melbourne real estate market is buzzing with potential at the start of 2024, offering a plethora of opportunities for savvy investors and homebuyers alike. So, what suburbs will boom in Melbourne this year?
A handful of Melbourne suburbs recorded double-digit property price increases over 2023, bucking the city’s wider trend of modest growth.
Melbourne’s median house price median rose 2 per cent to $1,047,000 over the 12 months to December, and its unit price grew 4 per cent to almost $580,000 in the same period, the latest Domain House Price Report showed.
With an eye on the future, identifying suburbs with the promise of growth, affordability, and lifestyle appeal becomes crucial.
We will look into the top 10 Melbourne suburbs set to boom in 2024, alongside other noteworthy areas that promise unique opportunities.
Who will be my No #1 Best Melbourne cheapie suburb with the best capital growth potential in 2024?
You will need to watch this video to find out...
Don’t miss out, CLICK HERE to get up to date video education from Konrad Bobilak.
Did you know that Property Investors are swallowing up even more of the housing market?
In Australian politics there are relatively few issues outside of foreign policy that the two major parties can agree on. But there is one issue where both sides ostensibly agree: greater levels of home ownership.
In the run up to the last federal election, then Opposition Leader Anthony Albanese promised that a Labor government would help people achieve the “great Australian dream of home ownership”.
“For too long Australians who have worked hard have been locked out of the housing market by flat wages and rising prices, unable to even get a foot in the door let alone a roof over their heads,” Albanese said.
Opposition leader Peter Dutton shared similar views on home ownership with the press late last year: “the best way to empower Australians — to make them masters of their fate — is through home ownership.”
The leaders of the major parties sharing this view on home ownership is nothing new. Over 70 years ago there were debates in federal parliament not too dissimilar from todays, in which the leaders of the Coalition and Labor made their case on which party would do a better job building more new homes and getting more Australians into homes of their own.
Rhetoric collides with reality The peak rate of home ownership was recorded 57 years ago as part of the 1966 census, at which time 73 per cent of households owned homes. More recently, the Australian Institute Of Health and Welfare (AIHW) recorded a home ownership rate of 71.4 per cent in 1995. As of the latest data from the 2021 census, the home ownership rate has dropped to 66 per cent.
This raises an uncomfortable question for the nation’s leaders. After spending more than $20.5 billion on grants, concessions and other cash grants to first home buyers in the decade to 2021, home ownership rates have not risen, but instead have continued to decline.
Solely based on the decline in the proportion of households who own homes, there around 560,000 households who are renting today who would have otherwise been homeowners if the home ownership rate remained as it was in 1995.
Rise and rise Despite rising levels of home ownership being the stated priority of both the major parties their policies have achieved the polar opposite. The AIHW data instead illustrates a very different trend: the rise of the property investor.
In 1995, 18.4 per cent of households rented from a private landlord. As of 2020, 26.2 per cent rented from a private landlord and this is arguably somewhat distorted lower by the snapshot being taken during the pandemic.
If we extrapolate that on to the current number of households as determined by the ABS, private landlords have roughly 810,000 more tenant households today than they would have if the ratio of private landlord held housing to overall housing stock remained the same as 1995.
Today’s market According to data from the ABS, over the last 12 months 33.4 per cent of new mortgages for existing properties have flowed to property investors. In terms of new mortgages overall including construction loans and brand-new properties, that figure rises to 34.3 per cent.
By dollar value the proportion of mortgage lending flowing to investors recently hit the highest level since 2017, hitting a share of 36.2 per cent of all new housing finance.
With investors holding 26.2 per cent of occupied housing stock, this level of activity implies a growing proportion of the nation’s housing stock once more flowing to investors, unless otherwise offset by a much greater proportion of owner occupiers making fully cash purchases or investors selling out of the market at a greater rate than they are buying in.
Which raises the big question in all of this, how is the home ownership rate going to rise when the current set of incentives and policies have delivered 25 years of strong growth in the proportion of investor held housing stock instead?
Aspiration nation Both of the major parties like to paint themselves as the standard bearers for aspirational Australians, of folks who are trying to get ahead. But the simple reality is recipe for success is not what it once was.
In decades past, a household could work hard within the reality of their circumstances and work their way up to a median or well above median household income, then be able to purchase a home that reflected that.
In 1999, a household in the 80th percentile for income (higher than 80% of households), could purchase a home that was valued in the 80th percentile. Meanwhile the median earning household could purchase the median house. This is based a household having a 20 per cent deposit, additional cash for stamp duty and spending 25 per cent of gross income on the mortgage.
Today the median earning household can only afford 13 per cent of homes and even more affluent households in the 80th percentile are now competing for median priced homes. In states like NSW and Victoria its even worse. In NSW, households in the 80th percentile can only afford 1/3 of homes, while in Victoria less than half are affordable for these more affluent households.
Reality check Both Labor and the Coalition speak of hard work and the importance of home ownership, yet neither has the makings of a credible plan that would see home ownership rates increase back toward levels seen in the mid-1990s, let alone the all-time peak.
It was once said that doing the same thing again and again, and expecting a different result was the definition of insanity. After spending over $20 billion on first homebuyer support mechanisms over the past decade and actually lowering the home ownership rate during that time, it’s clear a different strategy is needed.
Ultimately, where we go from here is in the hands of the electorate. For decades political leaders have talked the talk on home ownership, then failed to walk the walk. Up until now that arguably hasn’t had a major political downside for the major parties, but with the issue of housing fast becoming one of the hottest in Canberra and around dining tables, one wonders if that will change.
Dear Fellow Property Investor,
Australian big city house prices are tipped to surge by more than a third during the next three years with Sydney's median price set to hit the $2 million mark.
The increases forecast between now and June 2027 would be even more significant than the price rises since the onset of Covid four years ago, which covered interest rates aggressively rising from record-low levels as immigration soared.
Oxford Economics Australia is forecasting that Sydney's median house price will hit $1.934million by June 2027, with Perth reaching $1million.
The median price in Melbourne and Brisbane was also expected to reach seven figures during the same period as prices rose between a third and 43 per cent.
Even before the rate cuts, Australian home lending has increased 13.3 per cent during the past year in a sign buyers fear missing out on more price rises, new official lending figures released on Monday revealed.
This means average-income earners on a $98,218 salary, and with plenty of savings for a 20 per cent mortgage deposit, are being urged to shop around now for a suburban house or inner-city unit under $640,000 to avoid missing out on the boom.
Until the Reserve Bank cuts interest rates, possibly from late 2024, banks are only able to lend a borrower 5.2 times their pay before tax.
But once the rate cuts start, banks will be able to lend more, leading to even higher prices, with values tipped to particularly soar at the more affordable end of the market.
'The November 2023 cash rate hike to 4.35 per cent is expected to be the last this cycle, with the next movement downward,' Oxford Economics Australia said.
'Anticipated interest rate cuts from late 2024, overlaid by a sustained housing shortage, are set to accelerate price growth in 2025.'
Australia's net overseas migration level hit a record high of 548,800 in the year to September but Oxford Economics Australia is expecting that to slow to 410,000 in 2023-24 and 250,000 by the 2026-27 financial year.
'Net overseas migration is driving the current surge in Australia's population growth,' Oxford Economics Australia said.
'While three-quarters of new overseas arrivals enter the rental market, which relies on investor supply, there remains a channel that is adding to the competition for established properties.'
The more affordable end of the property market is tipped to soar as baby boomers downsize and those aged 30 to 45 look to escape rising rents.
'Strong growth in rents is likely having a spillover effect, encouraging some households to enter owner-occupation,' the report said.
Price rises are tipped to grow by at weaker pace in cities like Adelaide and Hobart, that boomed during the pandemic but no longer receive a huge influx of interstate migration.
Canberra, now Australia's second most expensive capital city market after Sydney, was tipped to slip into fourth place behind Melbourne and Brisbane by mid-2027 - even with a typical house price in the seven figures.
Let me ask you something…
Do you have a game plan for 2024?
Or will you watch savvy, educated, market-ready investors snap up all the bargains at the bottom of the Melbourne property cycle (which, in my opinion, already bottomed out in November 2022), again?
Or, will you join them?
So, what are you waiting for?
Reserve your place and join me and 55 like-minded property investors for the first Real Estate Investing Fast Track Weekend for 2024!
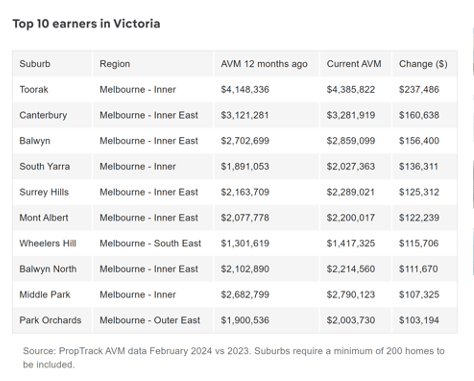
With property prices reaching record highs across the country, the humble home has become the main breadwinner in many households. In certain suburbs, homes are earning multiple times the average wage.
National property prices hit new record highs in February, up 6.15% compared to a year ago, the fastest annual rise since July 2022, according to PropTrack.
For hundreds of thousands of Australians, that growth means their homes may have generated more income than their own salaries over the past year.
New analysis has used PropTrack's automation valuation model (AVM) to reveal the suburbs around the country where the median property price has grown by more than the average Australian wage.
According to ABS data released in February, the gross weekly ordinary time earnings for full-time adults was $1,888.80 in November 2023, which translates to average annual earnings of $98,218. Given the family home is exempt from the capital gains tax, an increase in value stretches even further than the average annual wage on a dollar-for-dollar basis.
Almost 900 suburbs around the country saw their median property price grow by more than $98,218 in the year to February.
The suburbs that saw the steepest hikes in value were the premium pockets in capital cities, which is unsurprising according to PropTrack senior economist Paul Ryan.
"In exclusive suburbs the same percentage increase will lead to a larger increase in terms of dollar value. And remember too, some of those premium suburbs saw quite sharp reductions in prices in 2022 so this is prices snapping back."
But solid price growth also happened in more affordable areas, Mr Ryan added.
"Over the past year or so, we've seen even and consistent growth within cities. While we're still seeing strong demand and strong growth in premium suburbs, this is happening in more affordable suburbs too."
Melbourne property prices grew by a relatively modest 1.33% over the year, but in the exclusive inner-Melbourne suburbs of Toorak and South Yarra, houses gained $237,486 and $136,311 respectively.
Here are the suburbs in Melbourne where properties have earned the most this past year:
Let me ask you something…
Do you have a game plan for 2024?
Or will you watch savvy, educated, market-ready investors snap up all the bargains at the bottom of the Melbourne property cycle (which, in my opinion, already bottomed out in November 2022), again?
Or, will you join them?
So, what are you waiting for?
Reserve your place and join me and 55 like-minded property investors for the first Real Estate Investing Fast Track Weekend for 2024!
Apartments are selling at a loss in Australia's two biggest cities even during a housing affordability crisis, new data shows.
Record-high immigration has pushed up house prices but more inner-city units are selling at a loss in already-overcrowded Sydney and Melbourne than anywhere else.
An ultra-tight rental market and a digit-double surge in rents during the past year is also no guarantee that units will go up in value, especially if they are in a high-rise tower.
In the centre of Melbourne, 40.7 per cent of apartments sold at a loss during the December quarter - or 6.8 times the national average loss rate of 6 per cent, CoreLogic data showed.
Tim Lawless, CoreLogic's head of research, said oversupply was an issue in that part of Melbourne.
'Higher supply levels across the inner Melbourne apartments sector are likely to be a factor in this under performance, coupled with the preference shift towards lower density housing options though the pandemic,' he told Daily Mail Australia.
'Areas of inner Melbourne are now recording the highest population density of any region nationally.'
In the centre of Melbourne, 40.7 per cent of apartments sold at a loss during the December quarter - or 6.8 times the national average loss rate of 6 per cent, CoreLogic data showed (pictured is the Docklands area near the city) - and 98 per cent of loss-making sales were apartments.
CoreLogic noted that 98 per cent of loss-making sales were apartments, even though sellers in the Melbourne City Council area had held on to their apartments for an average of nine years and eight months.
Losses are more likely to occur in areas where apartments were built during the 2010s, when interest rates were lower and building activity was much stronger.
This has led to an oversupply of apartments in some areas and in some cases, quality issues.
'Unit supply was particularly elevated in the mid-to-late 2010s, buoyed by a high concentration of investor participation in the housing market and structurally falling interest rates,' CoreLogic said.
In Melbourne's city centre, the median apartments price is $473,483, or 28.2 per cent less than greater Melbourne's mid-point apartments price of $607,473.
Despite the tight rental vacancy rate, North Melbourne's apartments prices fell 0.3 per cent during the past year to $505,702.
Apartments are even cheaper at Flemington with a median unit price of $410,528.
But at Docklands, they are a bit dearer at $592,863, which would still be attainable for an average-income worker on $98,218.
In the neighbouring Port Phillip City Council area, 21.3 per cent of apartments sold at a loss, with this densely-populated area covering bayside St Kilda where the median apartments price is $530,584.
In Windsor, the median apartments price plunged by 6.2 per cent during the past year to $512,633.
Next door in the Stonnington council area, 27 per cent of apartments sold at a loss.
This covers South Yarra, a suburb with a median apartments price of $579,182, following a 4.2 per cent decline during the past year.
In ultra-upmarket Toorak, the mid-point apartment price fell by 3.4 per cent over the year to $1.033million.
So my advice is do not buy apartments in Melbourne CBD just yet…unless you are taking on a ultra long-term investment horizon and plan to hold them for 20 to 30 years!
If you have enjoyed this short email, then I encourage you to reserve your place and join me and 55 like-minded property investors for the next Real Estate Investing Fast Track Weekend for 2024!
Don’t miss out, CLICK HERE to get up to date video education from Konrad Bobilak.
Are the Stage 3 tax cuts fair (and will they happen)?
On January 15, Prime Minister Anthony Albanese said the Stage 3 tax cuts were here to stay despite Labor’s consistent reservations, according to the Australian Associated Press.
Since then, the conversation has swirled about the fairness of the Stage 3 tax cuts, which is set to cost the government $313 billion over 10 years.
By January 22, one media outlet had claimed that the tax cuts were not going ahead as planned – although at the time of writing, there has been no changes to the Stage 3 tax cuts.
With the $1,500 tax offset ending this financial year, many workers that earn under the Australian average annual salary of $90,000 will be worse off in net terms despite the tax break.
In a cost-of-living crisis, the fact that someone earning $200,000 receives a $9,075 tax break while someone earning $40,000 gets no immediate benefit can feel unfair.
Others have made the case that the tax overhaul could save $130 billion off the total bill if it were reweighted towards lower income earners.
However, the reason Australia's middle- and higher-income earners are set to receive the major tax breaks is because they bear the larger share of the tax burden, according to property expert Ben Kingsley.
“And so they should, but how much is too much?” said Kingsley, founder and director of Empower Wealth, which was recently named Liberty Australian Brokerage of the Year at the 2023 Australian Mortgage Awards.
“Squaring up the ledger a bit whilst also addressing bracket creep is a fairer outcome.”
For example, Kingsley said someone earning $70,000, currently paid $13,217 in taxes. Now double their income to $140,000. Their tax bill jumps to $36,867 – that’s 179% more than the lower earner, not just double.
With the new Stage 3 cuts, that number falls to 166% higher – ($12,592 compared to $33,592).
Watson agreed, “I think for most Australians, the tax cuts have been enacted to provide improved equality for everyday Australians, particularly for ‘middle Australia’ who do a lot of our country’s heavy lifting.”
What are the Stage 3 tax cuts?
The Stage 3 tax cuts are the final part of a three-phased tax reform plan legislated in 2019 and are set to come into effect for the 2024/25 income year.
It involves changes to personal income tax brackets, primarily affecting earners between $45,000 and $200,000.
There will be two key changes:
Merging tax brackets: The existing 32.5% and 37% tax brackets will be merged into a single 30% bracket for those earning between $45,001 and $120,000.
Raising the top tax threshold: The 45% tax bracket will start at $200,000 instead of $180,000.
What does all this mean for borrowing capacity?
In terms of borrowing capacity, prospective homebuyers will likely be the ones to benefit the most.
Borrowing power could increase by $15,000 for someone with $100,000 annual income and around $100,000 for someone on a $200,000 income – and that’s assuming APRA still leaves the buffer rate at 3% on lending servicing.
“Borrowing powers are based on your net income,”
“Banks subtract your expenses, and then lend to you based on your leftover income available. These tax cuts directly increase the leftover income. The higher your income, the larger the boost to your borrowing power is.”
“For the rare households with two income earners above $200,000, there's potentially a $200,000 increase coming your way.”
Dear Fellow Property Investor,
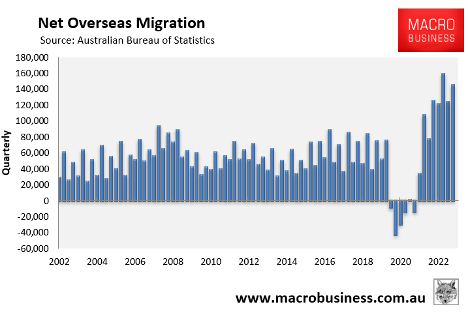
If you are wondering why Australia is suffering its worst rental crisis in living memory, look no further than today’s official September quarter immigration data from the Australian Bureau of Statistics (ABS).
Australia’s population surged by 660,000 people in the year to September 2023, driven by a record-high net overseas migration of 549,000:
145,200 net overseas migrants landed in Australia in the September quarter of 2023, the second highest quarterly figure on record behind March 2023:
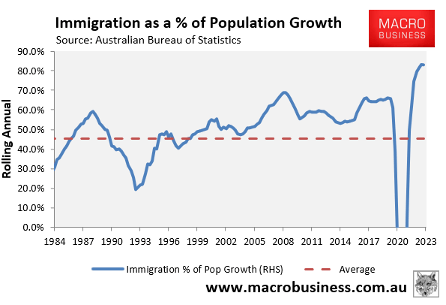
Net overseas migration as a share of Australia’s month remained at a record high of 83% in the September quarter of 2023:
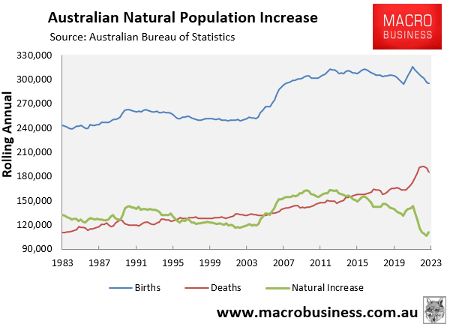
Meanwhile, natural population increase was a historically low 111,000 in the year to September, courtesy of a jump in deaths, most likely related to the baby boomers dying off and the impacts of the pandemic.
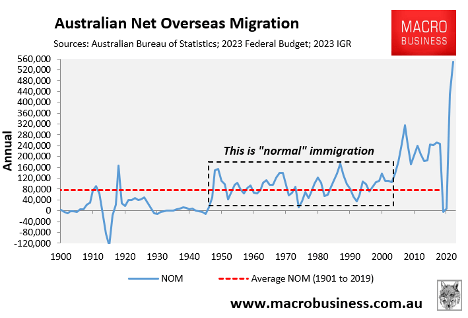
Finally, the next chart shows the explosion in net overseas migration on a historical basis dating back to Federation in 1901:
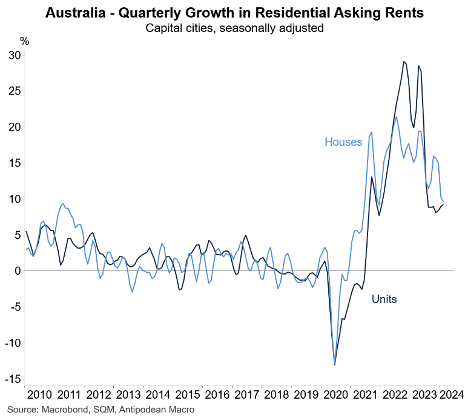
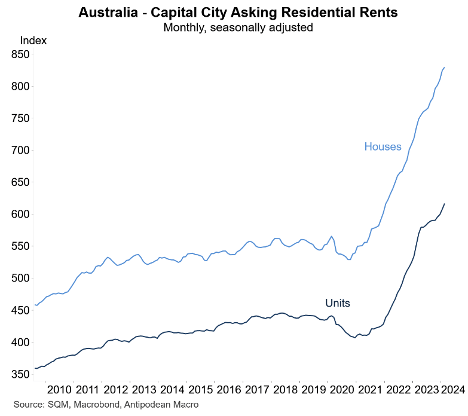
Notice how residential rents fell at the beginning of the pandemic when net overseas migration was negative, only to explode when net overseas migration surged?
The Albanese government’s extreme immigration program is why Australia has experienced such a severe shortage of accommodation and a rental crisis.
Anyone who denies this fact is a liar.
Let me ask you something…
Do you have a game plan for 2024?
Or will you watch savvy, educated, market-ready investors snap up all the bargains at the bottom of the Melbourne property cycle (which in my opinion by the way has already bottomed out in November 2022),
Or will you join them?
So, what are you waiting for?
Reserve your place and join me and 55 like-minded property investors for the Real Estate Investing Fast Track Weekend!
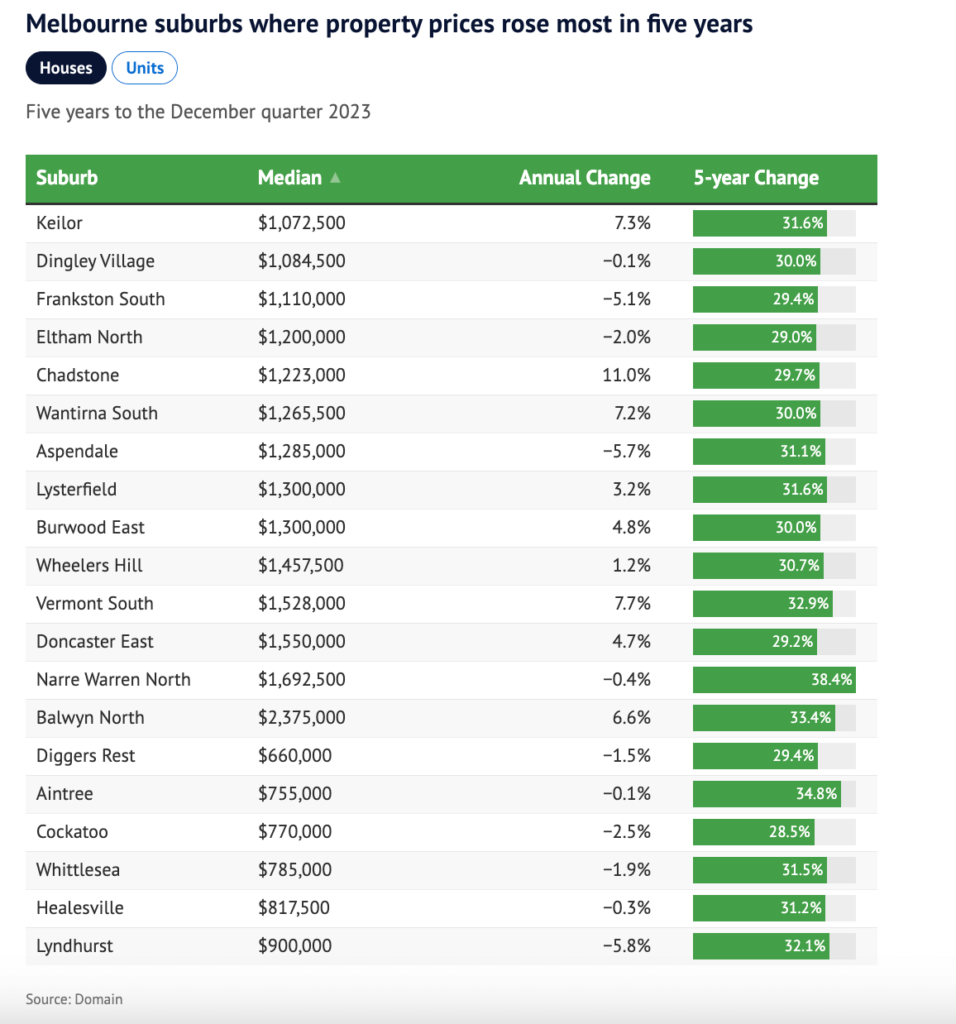
Did you know that a mix of middle and outer Melbourne suburbs can be revealed as the city’s best performing over the past five years, after the house price medians grew as much as 40 per cent in some locales.
Unit prices grew the most in Mitcham, where they jumped 21.3 per cent over the five years to $752,000. It was followed by Highett (19.6 per cent to $658,000) and Brighton (17.9 per cent to $1.2 million).
Melbourne’s overall median house price rose 22.1 per cent in the same period. Although it remains below its peak, the market has somewhat improved in recent weeks as clearance rates point to modest price rises and home buyers show renewed activity in expectation of a Reserve Bank rate cut later in the year.
The analysis excludes the Mornington Peninsula, but growth was even stronger in popular sea-change destinations that swelled during lockdowns such as Blairgowrie, Sorrento and Rye, which were up 66.3 per cent, 52.9 per cent and 52.8 per cent, respectively.
Let me ask you something…
Do you have a game plan for 2024?
Or will you watch savvy, educated, market-ready investors snap up all the bargains at the bottom of the Melbourne property cycle (which in my opinion by the way has already bottomed out in November 2022),
Or will you join them?
So, what are you waiting for?
Reserve your place and join me and 55 like-minded property investors for the Real Estate Investing Fast Track Weekend!
Don’t miss out, CLICK HERE to get up to date video education from Konrad Bobilak.
Dear Fellow Property Investor,
I realise that Apartments tend to get a bad rap when it comes to property investing.
And rightly so…many Melbourne suburbs such as Docklands, South Bank, and Melbourne CBD, just to name a few, have proven a complete disaster when it comes to long-term capital growth, with many apartments underperforming the rate of inflation…
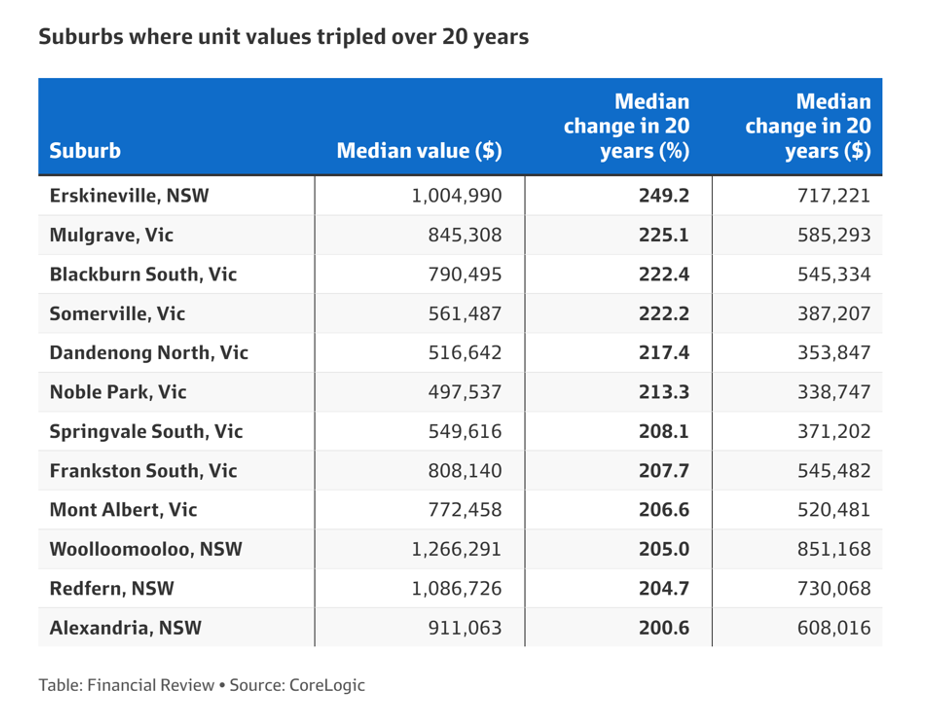
But did you know that according to a recent CoreLogic report, Unit [Apartments] values in Blackburn South and Mont Albert in Melbourne’s inner east, Mulgrave, Dandenong North, Noble Park, Springvale and Springvale South in the south-east and Somerville and Frankston South on the Mornington Peninsula have more than tripled in the past 20 years.
Unit prices in Melbourne climbed faster than both Sydney and Brisbane over the past 20 years, increasing by 120 per cent, data from CoreLogic shows.
Those gains were boosted by strong population growth and lower stock levels in the 2000s.
Sydney’s median unit value increased by 115 per cent, while Brisbane lifted by 81 per cent during the same period.
Underlining Melbourne’s performance over the past two decades, units across 85 per cent of all its suburbs more than doubled in value, while prices in more than 10 suburbs tripled over the same period.
A large chunk of the growth in Melbourne unit values in the past 20 years occurred before and after the GFC with unit values surging more than 20 per cent in 2007 and also in 2009-10, according to CoreLogic.
Let me ask you something…
Do you have a game plan for 2024?
Or will you watch savvy, educated, market-ready investors snap up all the bargains at the bottom of the Melbourne property cycle (which, in my opinion, already bottomed out in November 2022), again?
Or, will you join them?
So, what are you waiting for?
Reserve your place and join me and 55 like-minded property investors for the first Real Estate Investing Fast Track Weekend for 2024!
Interested in learning more about property investing in Australia? Please visit our main website InvestorsPrime.com.au for loads of free resources, articles, videos and more to help you on your investing journey.